What to plant next season is the biggest decision of the farm year, and it is still made largely by habit. Farmers rarely have the data to see how a field has performed, what its soil and climate support, or what another crop would earn - and a wrong choice costs a full season. This project uses data from the United States only.
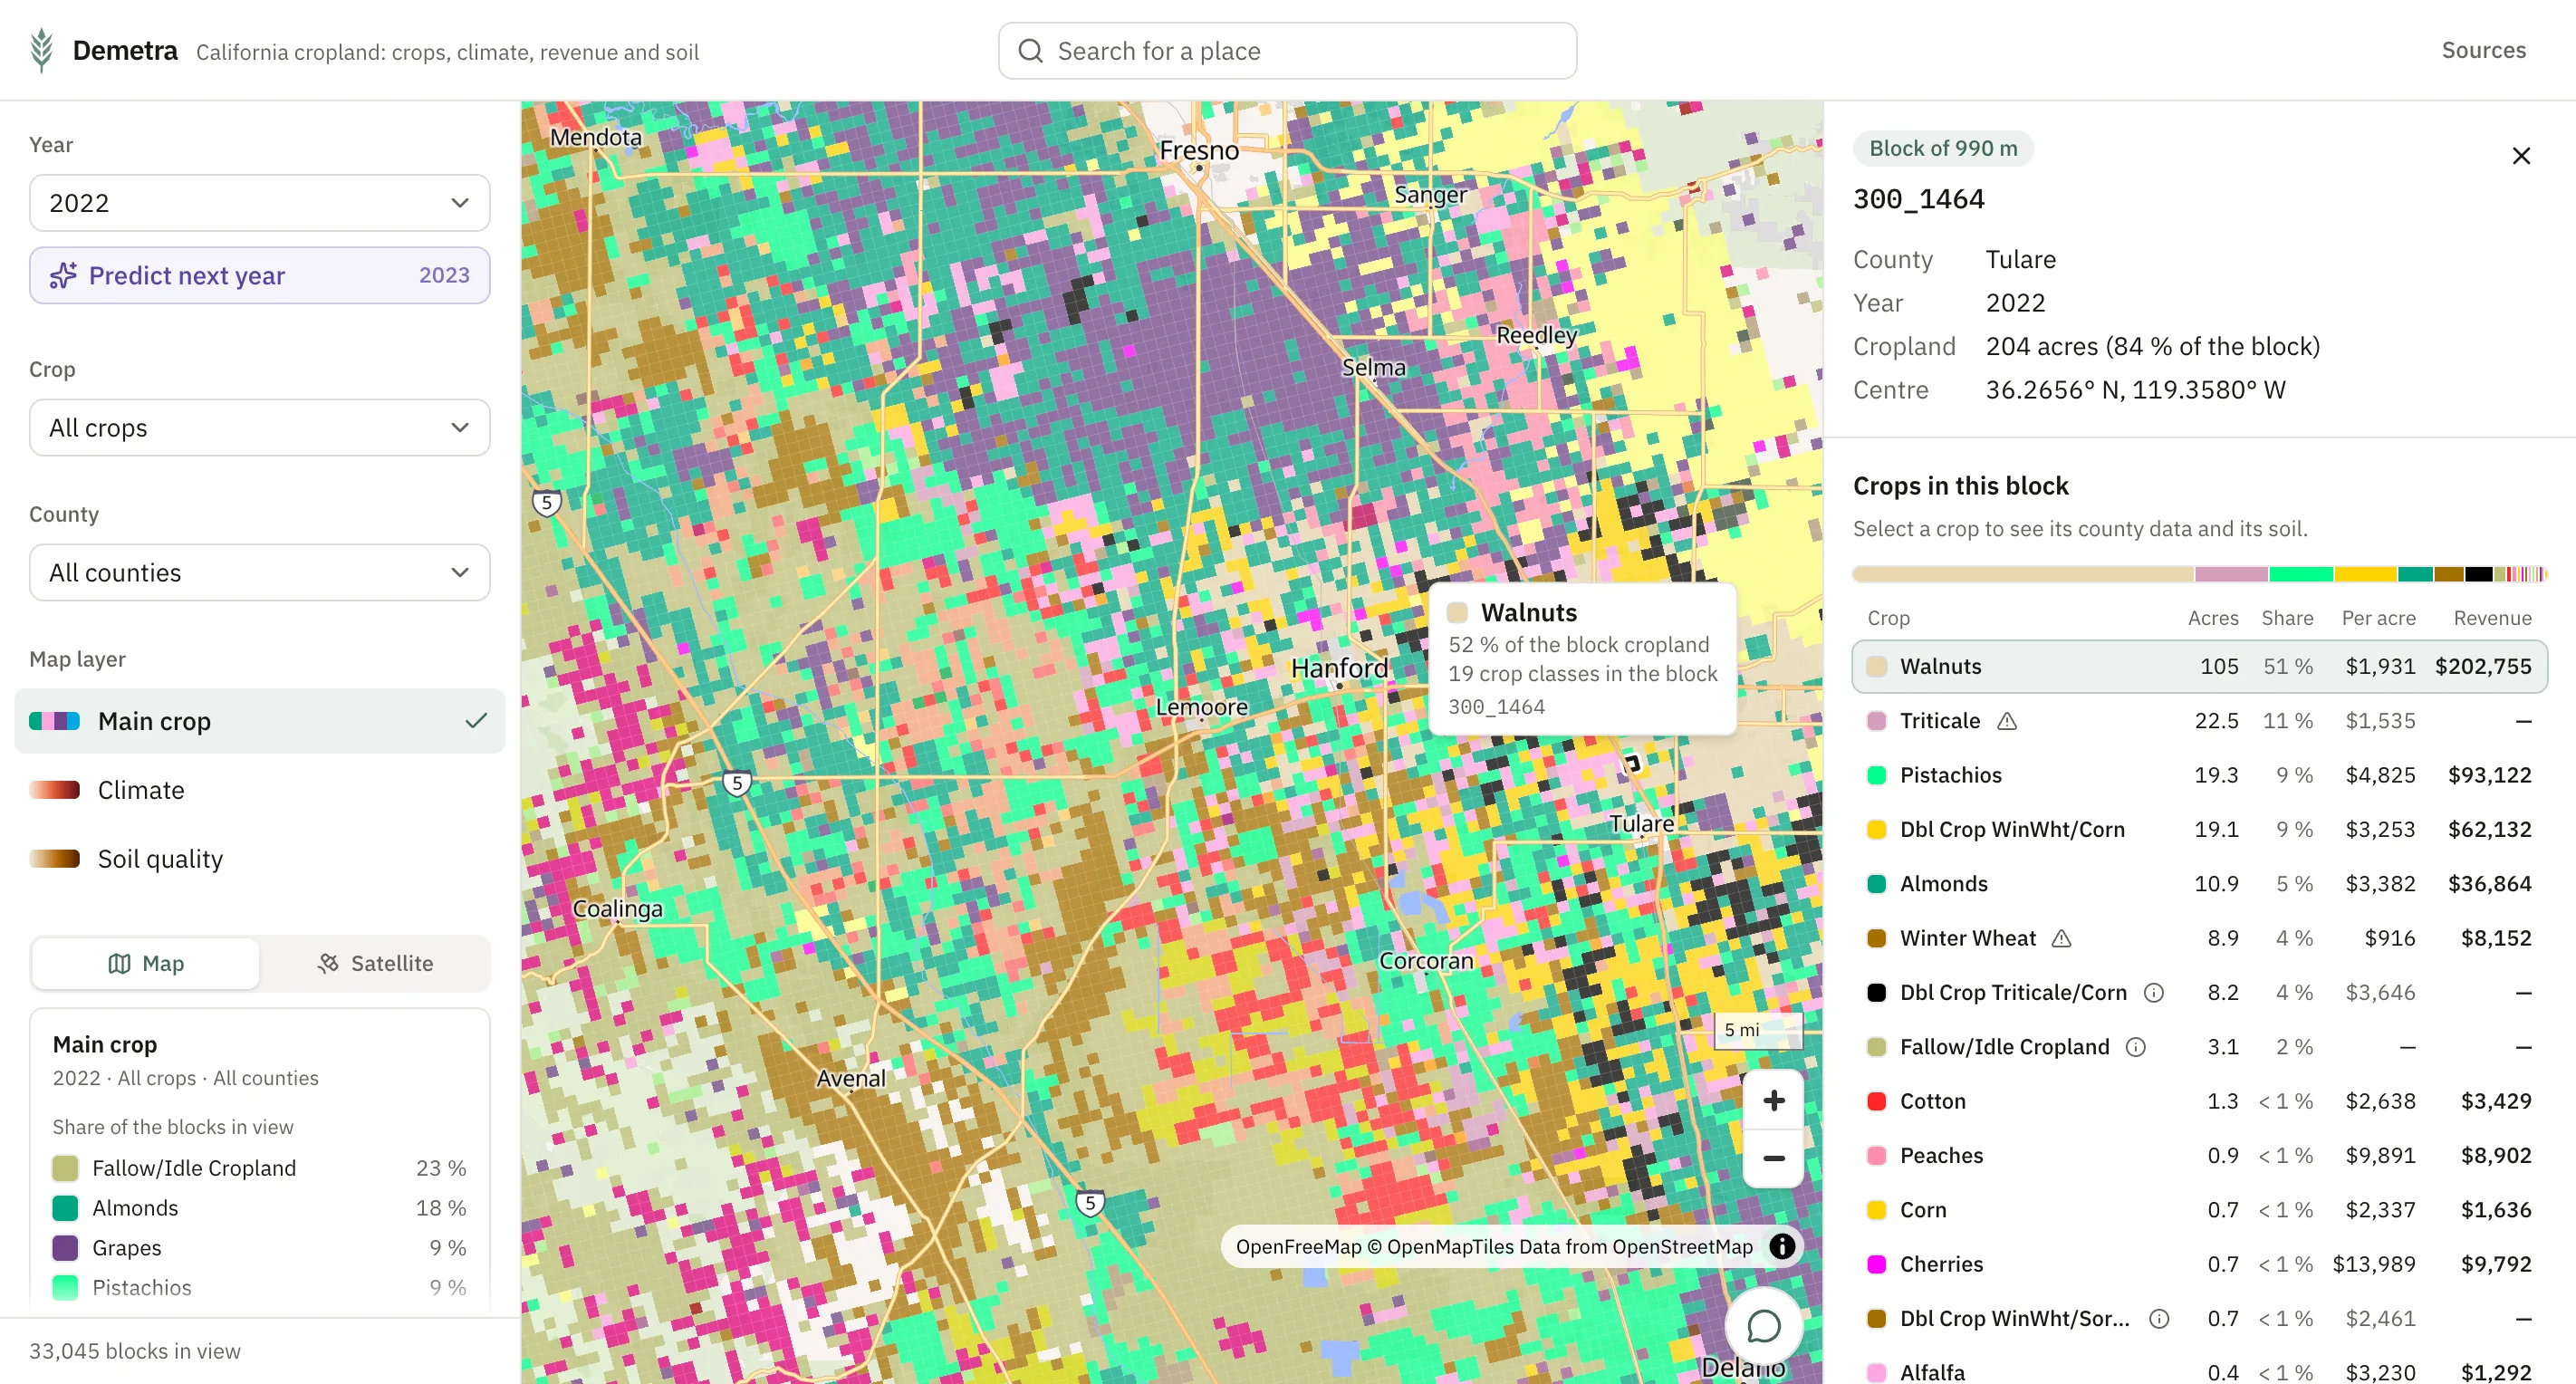
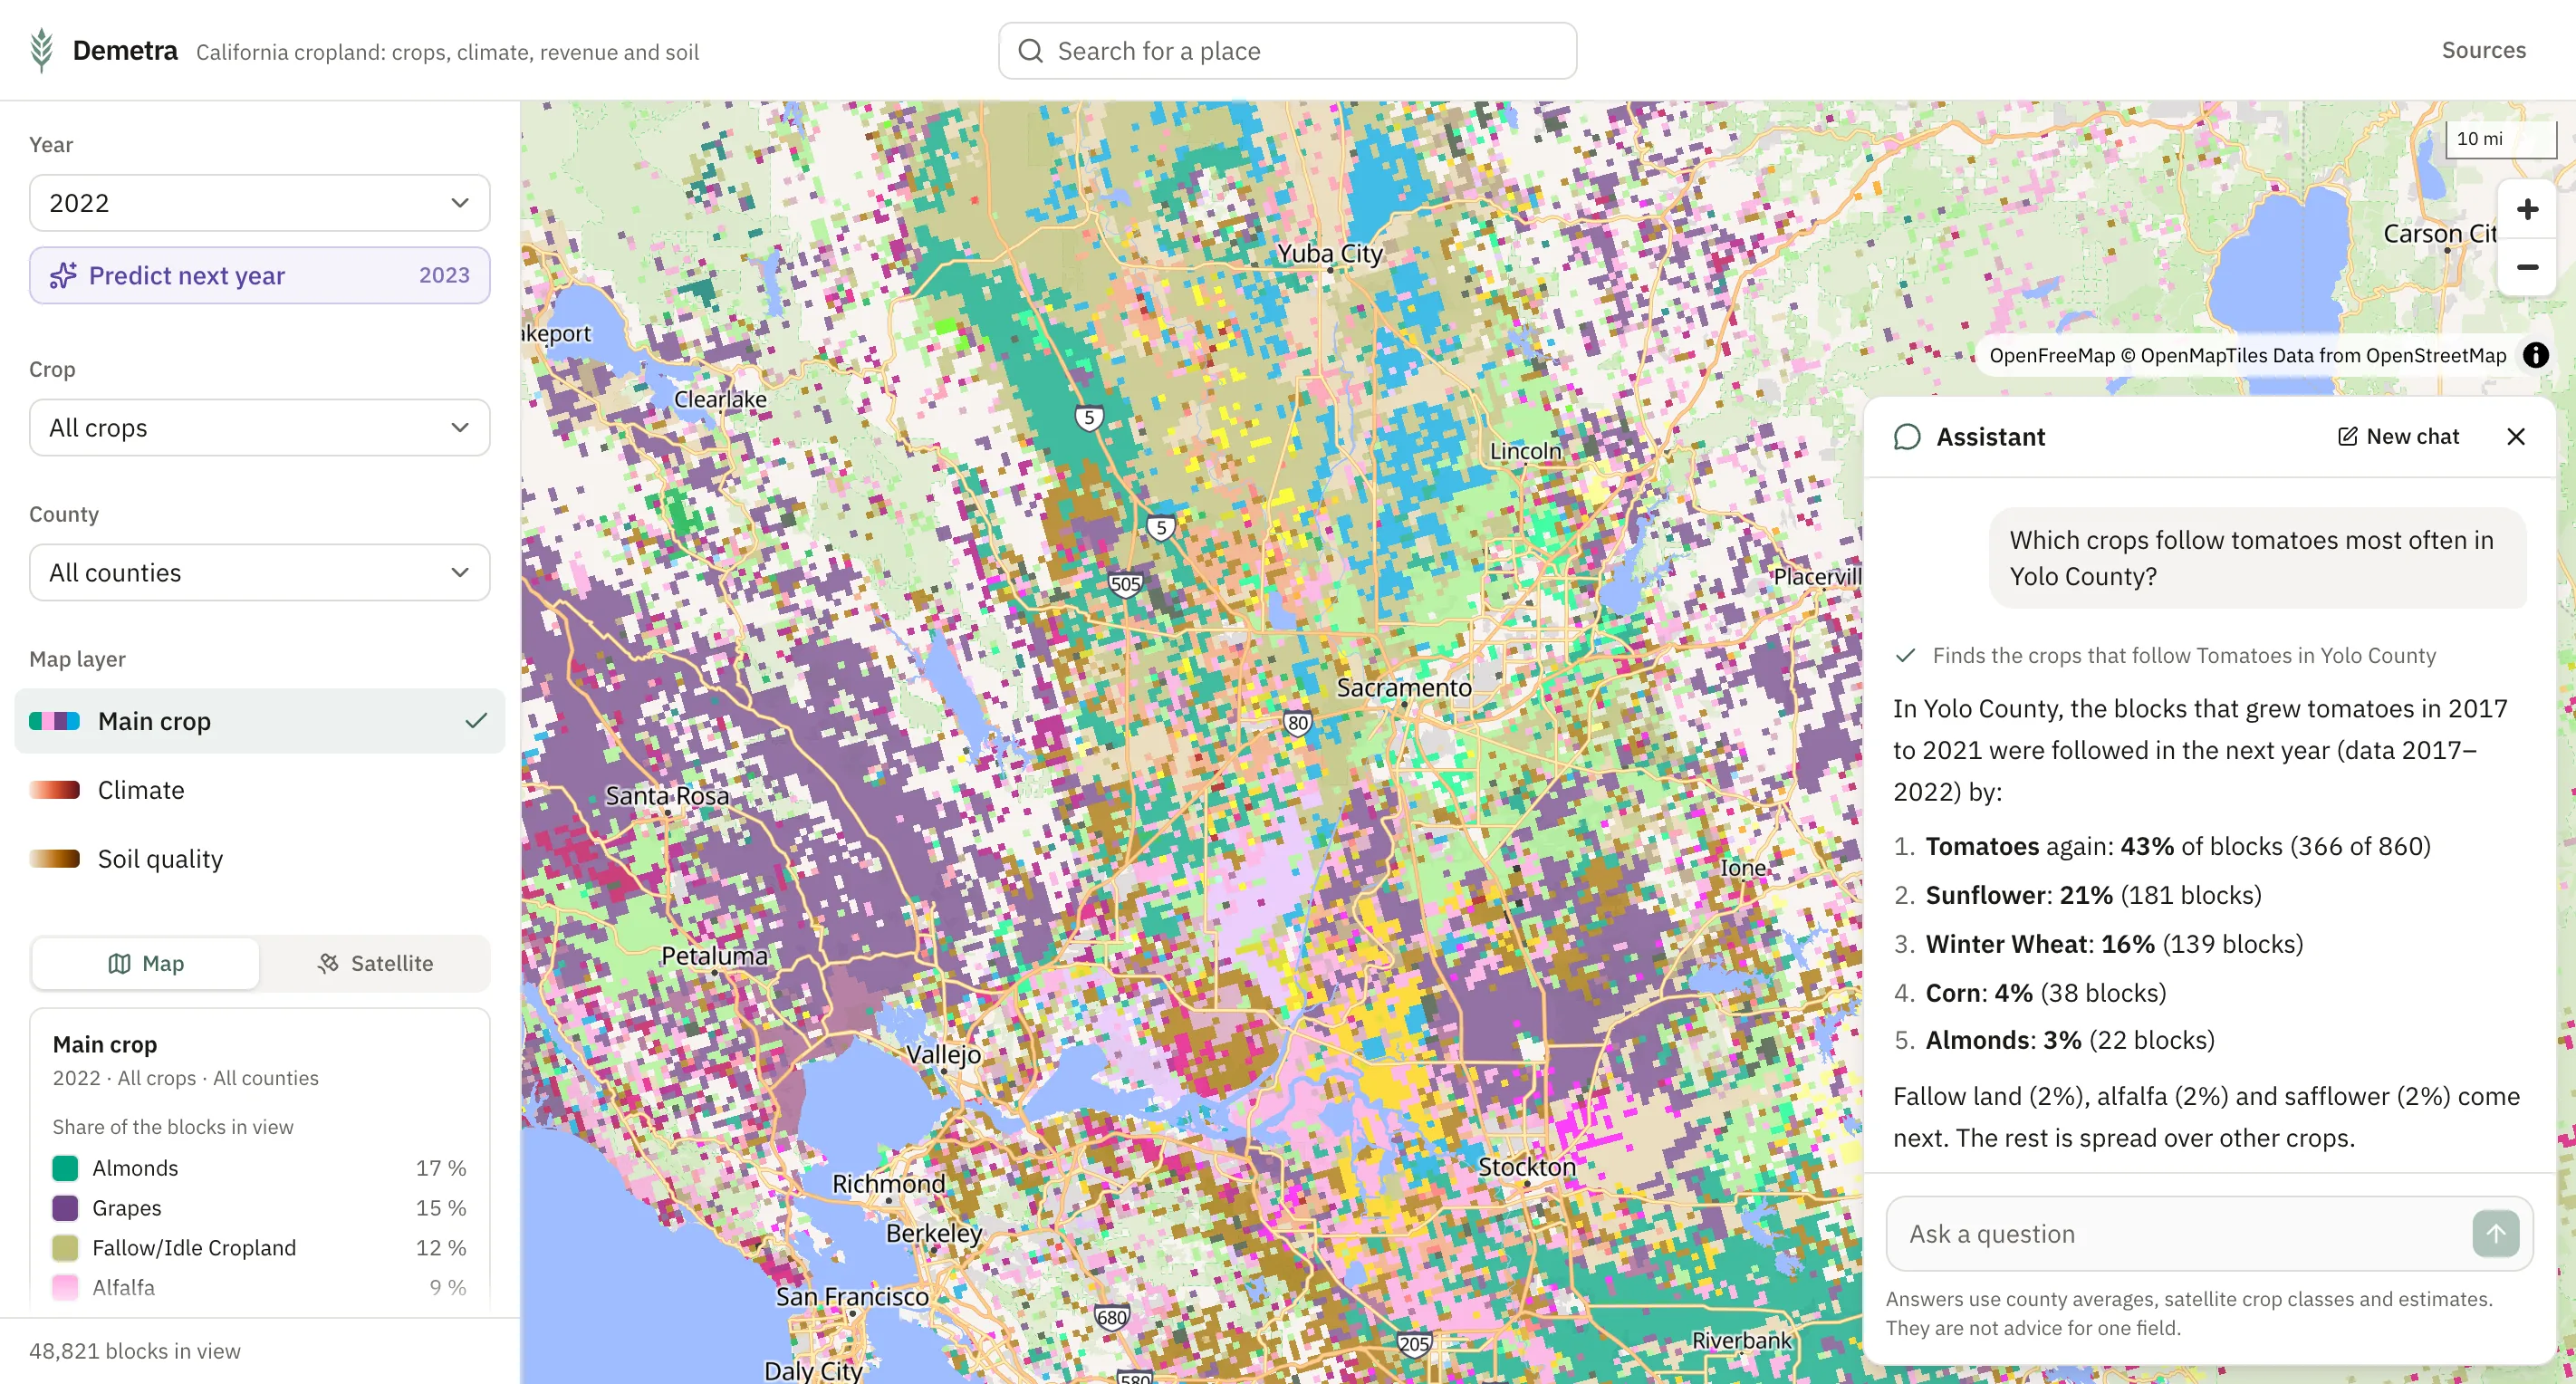
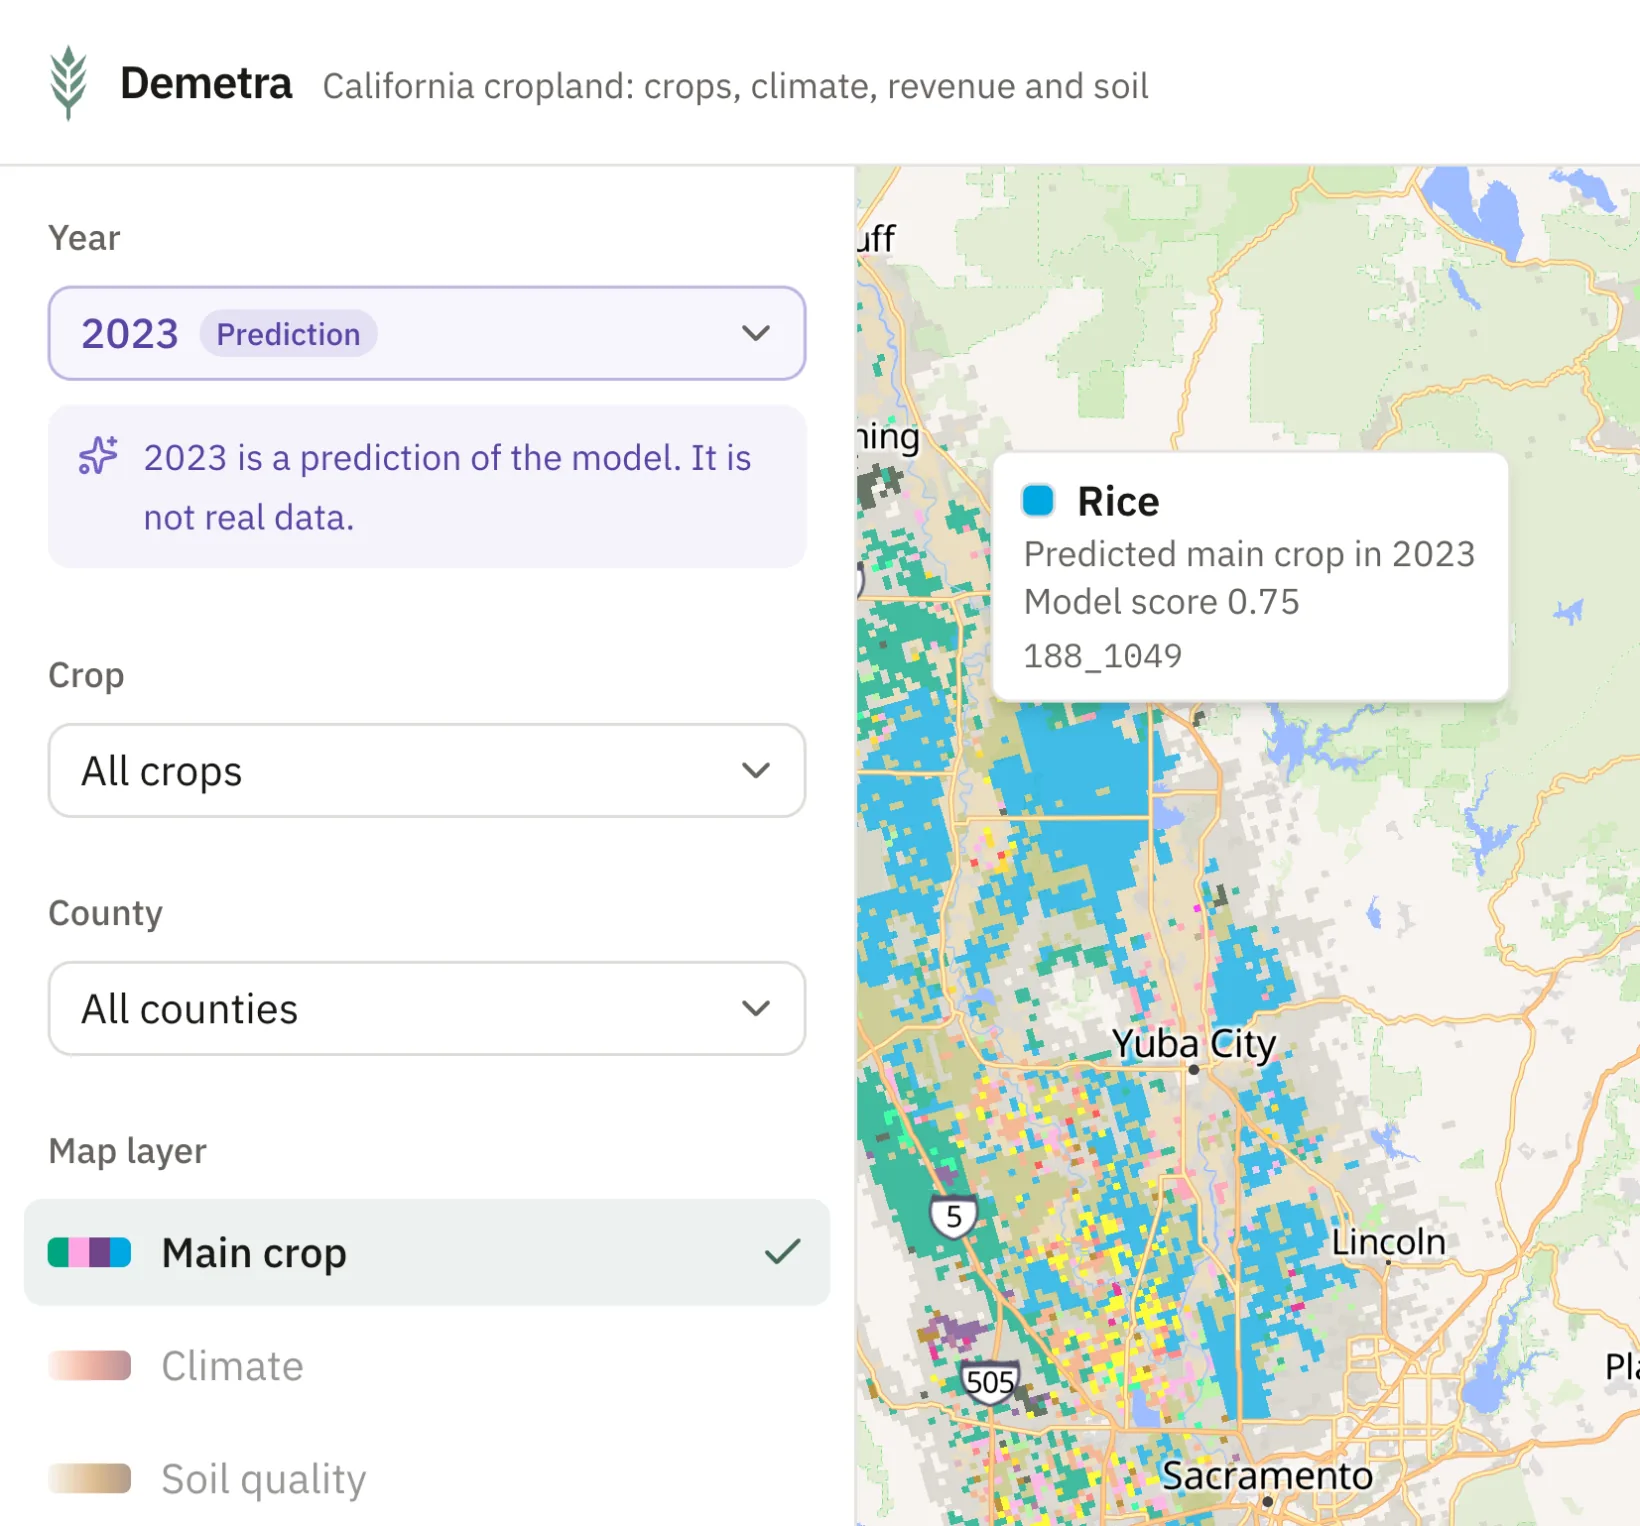
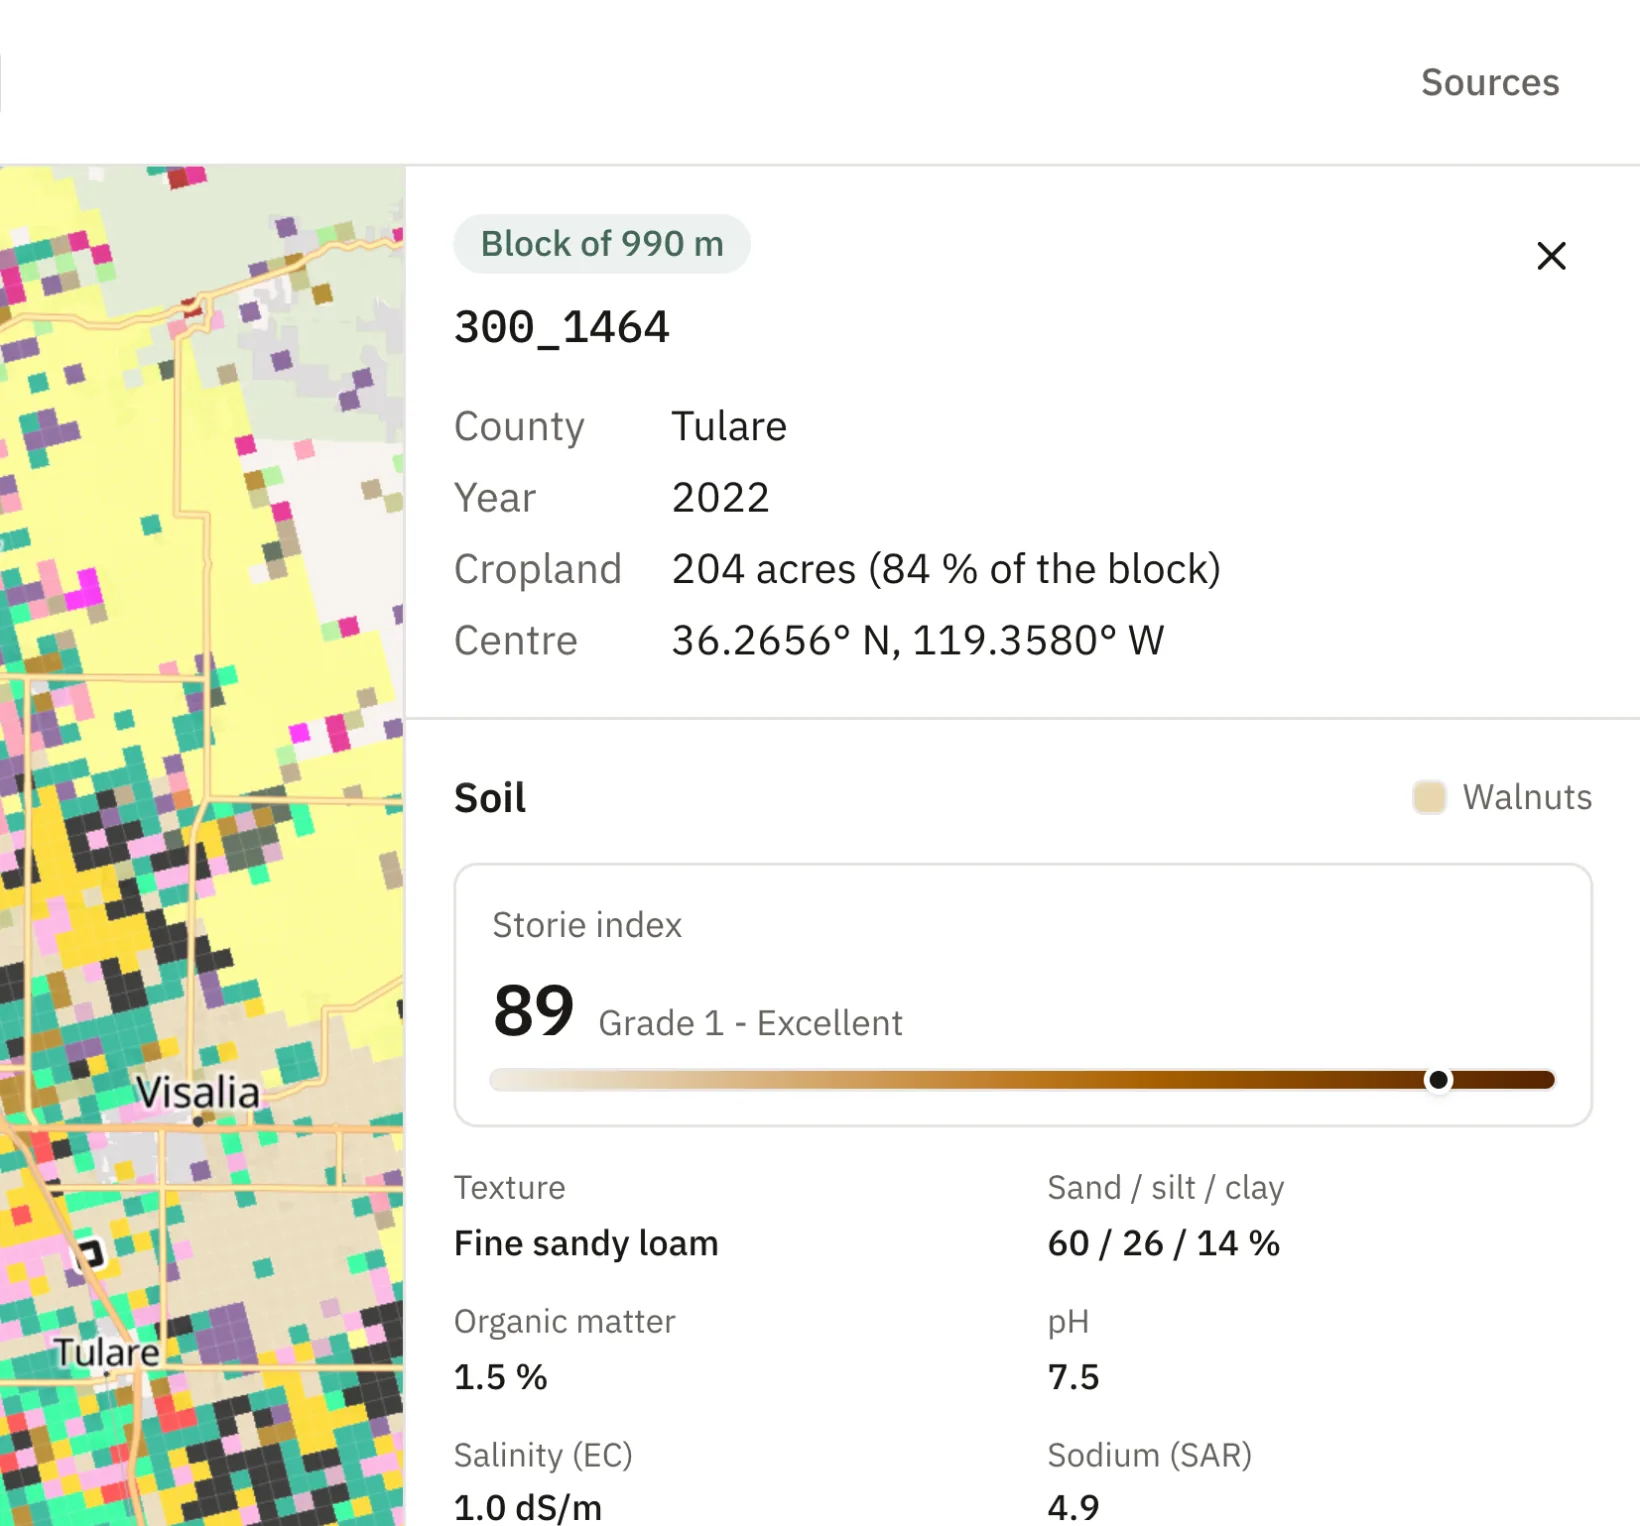
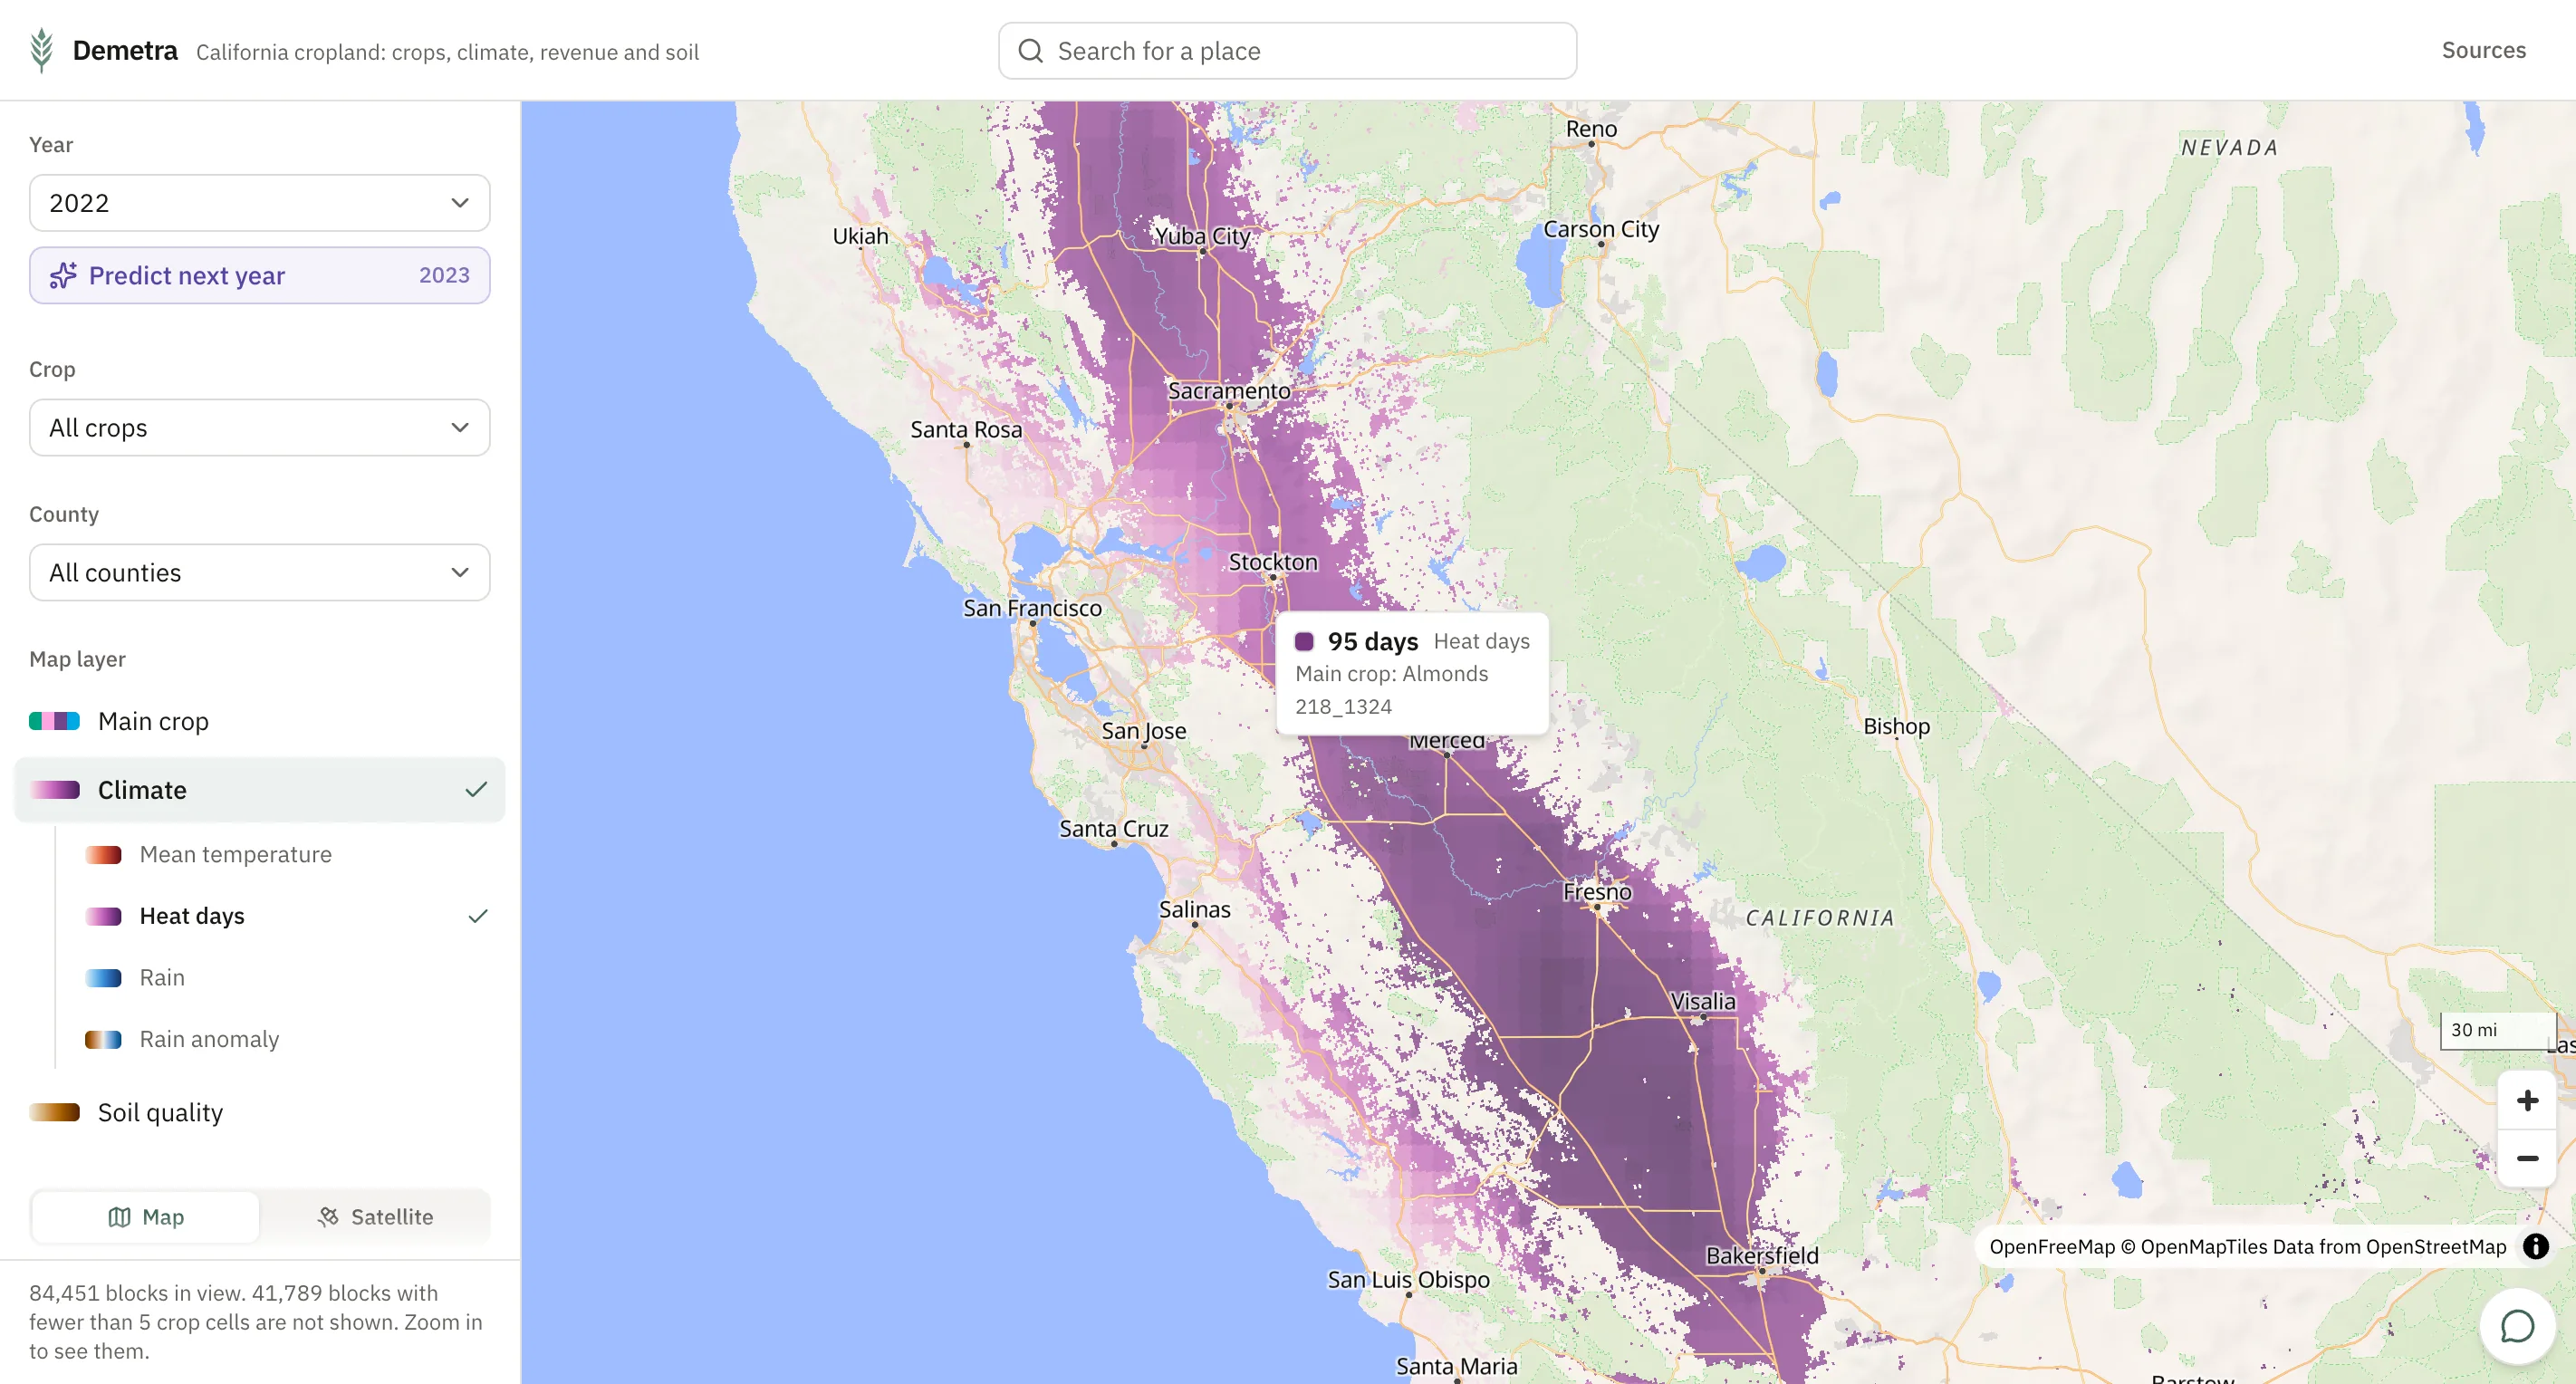
Demetra, built for the NASA Space Apps Challenge 2026, puts that information on one map. For every 990m block of California cropland, it shows what grew there each year, its estimated revenue, the soil below it and the climate of the year. It then predicts the next crop, and an AI assistant answers questions about any block.
Designed as one system, from the database to the map. Six years of USDA Cropland Data Layer, gSSURGO soil and NASA POWER climate data cover 150,000+ blocks in Postgres and PostGIS. An ExtraTrees model trained on that data makes the prediction, and the assistant reads the same data through tool calls. The API returns values, not geometry: the browser derives each square from its block id, which makes the payload 8x smaller.
Demetra, built for the NASA Space Apps Challenge 2026, puts that information on one map. For every 990m block of California cropland, it shows what grew there each year, its estimated revenue, the soil below it and the climate of the year. It then predicts the next crop, and an AI assistant answers questions about any block.
Designed as one system, from the database to the map. Six years of USDA Cropland Data Layer, gSSURGO soil and NASA POWER climate data cover 150,000+ blocks in Postgres and PostGIS. An ExtraTrees model trained on that data makes the prediction, and the assistant reads the same data through tool calls. The API returns values, not geometry: the browser derives each square from its block id, which makes the payload 8x smaller.
My Role
System Design